My intro to Kaggle
Anyone who has peaked into the worlds of data science or machine learning is likely to have heard of 'Kaggle'. They've been a resource for curated machine learning datasets for a number of years, and are becoming a hub for learning about, talking about, and practicing machine learning.
I spent a short while working my way through the short but highly interactive courses on the Kaggle site, and found these to be terrifically rewarding and engaging. The next step from working on any of these courses is to try your hand at a competition hosted on the site. The titanic competition is the most famous and likely the most accessible of these endeavours.
The titanic competition provides a number of features about the passengers of the titanic, and asks entrants to predict survival based upon what is known.
The features are as follows:
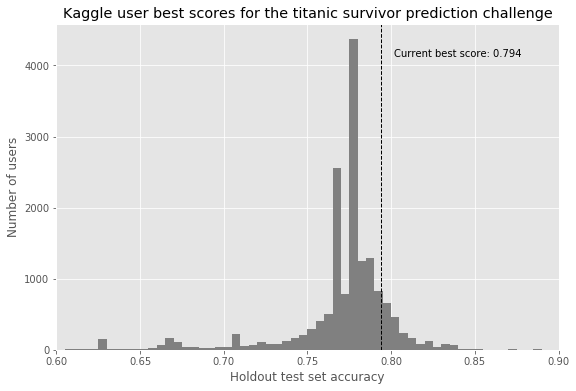
One of the more remarkable features about this challenge, which struck me as someone unfamiliar with the practice of unsupervised learning, is that simply by predicting all females to survive, and all males to die, we can get an accuracy of 0.76555, or 76.6% accuracy. To place within the top 5% of entrants on the rolling leaderboard (if we casually and recklessly dismiss anyone who got an accuracy of 100% on the Kaggle ‘test’ set as having rigged the system) you’d need a score of around 80.9%, and to place within the top 10%, you’d need 79.9%.
This is just to say, that many of the best attempts to solve this prediction problem are looking for an increase of around 5% in accuracy over the ‘baseline’ simple intuitive model (all women survive, all men die).
While I was actively seeking out tips on how to build machine learning models using python (this is my first major python project), I have been trying to actively avoid looking at how others have approached this problem until I reached a point I am happy with. At that point, after proving to myself that I can understand and use generalisable concepts, I’ll use the work and ideas of others on the titanic competition to improve my own.
Just as a primer to those of you not yet familiar with the details of machine learning processes:
- Machine learning definition:
- "Algorithms that parse data, learn from that data, and then apply what they’ve learned to make informed decisions"
- (an algorithm is just a set of instructions)
- Machine learning describes whenever a model to describe an outcome is derived from data, rather than a set of explicit instructions
- An analogy: recreating a cooked dish from a list of ingredients:
- Manual modelling:
- Someone writes their best set of instructions for how they think the dish is made based on experience (write a recipe yourself)
- Machine learning modelling:
- Computer tries a few random combinations of cooking techniques in a random order
- It takes the best (closest to what we want) resulting dishes and then changes a number of steps used to create them
- If these dishes are closer to what we want, do the same thing again
- Approaches to machine learning:
- The machine learning models discussed here are examples of supervised learning models, where the data is structured (having inputs and defined outputs) and labelled. When the models themselves decide the labels from unstructured data, this is unsupervised learning.
- The basic steps for modelling are to train, validate, and test the model. This requires a distinct ‘training’ data set and ‘validation’ data set.
- The model ‘sees’ the training set, and then we can predict the outcomes of the validation set to judge the accuracy of the model. We can then tweak the model to attempt to increase the accuracy of prediction.
- Once we are happy with the accuracy, we can then try this model on the test data.

The words below highlight my current attempt at the problem, with reference to previous iterations of my solutions. The evolution of my thinking and approach to solving this problem can be found here.
Current project state:
I came across an assured blog post* which categorically outlined why responsible use of pipelines is necessary for ensuring a project is as readable and interpretable as possible. In a regular workflow, the processing steps are in sequential order from when starting on the problem. In a pipeline you see only the necessary steps, presented in a modular format where each step is clearly defined. All of the work I had done up to this point involved creating a jupyter notebook to run a slew of exploratory code ending in the final model outputs. This wasn’t particularly easy reading, so I decided to convert my work into a functioning pipeline.
Aside from the vast improvement in readability, the pipeline offers the extremely useful feature of bounding all feature transformations within the same wrapper function, so training, validation and test datasets are subject the same manipulations. This is crucially important to reduce the impact of human error in dataset preprocessing.
Other than a brief introduction through the Kaggle course, I don’t have much experience with sklearn pipelines, so I set to learn by doing.
Pipeline outline:
- Select the features to take from the data set
- Join together two different sub-pipelines containing two sets of column processing:
- Categorical data (e.g. Sex, Name)
- Column selection
- Per-column specific transformations
- Split ‘name’ into Title, Surname, Maiden Surname
- Drop the original name column
- Split ‘ticket’ to give the ticket number
- Drop the original ticket column
- Interpret ‘cabin’ to count the number of cabins owned by that passenger
- Drop the original cabin column
- Convert ‘Pclass’ from numerical to categorical
- This is a subtle change, but makes sense as the ports are independent, rather than continuous data.
- Impute missing values (fill with the most frequent value from that column)
- ‘One Hot Encoder’ - sklearn modelling requires numerical representations of features, so categorical data must be transformed from strings into integers representing the same information. An intuitive example is that the ‘sex’ column, containing either ‘male’ or ‘female’ values, is transformed into two binary columns for male or female, with sex:male becoming male:1 and female:0.
- The encoder is given the ‘handle_unknown = ‘ignore’’ argument to ensure that any new entries found within any column in the test dataset do not confound the predictive model - for example titles such as ‘captain’ for which there were none in the training dataset, but could exist in other segments of the data.
- Numerical data
- Column selection
- Per-column specific transformations
- Made a column to track those travelling alone, with the thought that solo travellers might be less likely to survive.
- If ‘SibSp (count of siblings + spouses aboard) + Parch (count of parents + children aboard)’ = 0, Is_alone = 1
- Imputation of missing values: use the column median
- Apply the model (RandomForestClassifier)
Running this pipeline to train the model on a subset of the training data lacking the survival outcomes (X_train, 80% of the whole training dataset) was done using CVGridsearch, allowing tuning of the model parameters using the whole dataset to train and validate. Application of the best parameters gives a gridsearch score of 0.82588, and a Kaggle test set score of 0.78468. This shows that there is overfitting in this model, likely owing to deficiencies in the feature engineering.
What remains for me to do:
- I have the titles of each of the passengers, which pulls out ‘Master’. This title only applies to males under 14 in this dataset, which lines up with my knowledge of the use of this title. Odds are younger males are more likely to survive, but not all of these passengers have associated ages. Would be good to use the median of ‘Master’ age passengers for this subset for imputing ‘age’.
- I need to work out how to do this imputation within my pipeline
- Age imputation in general. The accuracy of imputation can likely be improved vastly by stratifying by the ‘Pclass’, ‘Title’, ‘Embarked’ and ‘Fare’ features.
External influences I have seen:
- Calculating per-passenger ‘fare’
- I didn’t realise, but it makes sense that the ‘fare’ price per ticket is actually the whole price paid for all of the passengers on the ticket. A more accurate value can be found from the per-passenger price
- This might lead to other information, such as being able to group passenger cabin location (or deck, at least) by per-passenger fare price. Deck number could very well be an important factor in determining survival
- Female survival based on whether all family members survived
- A suggestion is that it could be possible that the few females that do not survive might be those that go down with their family (for whatever reason).
- I’m not sure about this one, my initial impression was that it requires information that is not known at the time of prediction. However, thinking about it, it could simply be based on the prediction made for the other family members.

Comments
Post a Comment